Fatal Dog Attack Statistics
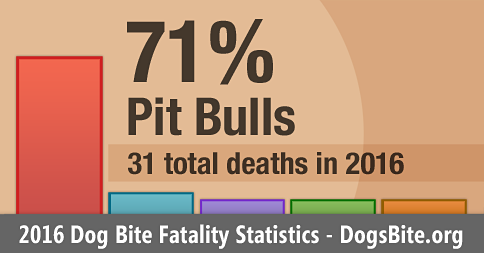
DogsBite.org recorded 31 fatal dog attacks in 2016. Pit bulls contributed to 71% (22) of these deaths, just over 7 times more than the next closest dog breed. The combination of pit bulls, their close cousins, American bulldogs (2), and rottweilers (2) contributed to 84% (26) of all dog bite-related fatalities. The last year the CDC collected "breed" data about fatal human dog attacks was 1998, nearly two decades ago. Since this time, pit bulls have killed over 300 U.S. citizens.
- 31 U.S. dog bite-related fatalities occurred in 2016. Despite being regulated in Military Housing areas and over 900 U.S. cities, pit bulls contributed to 71% (22) of these deaths. Pit bulls make up about 6% of the total U.S. dog population.
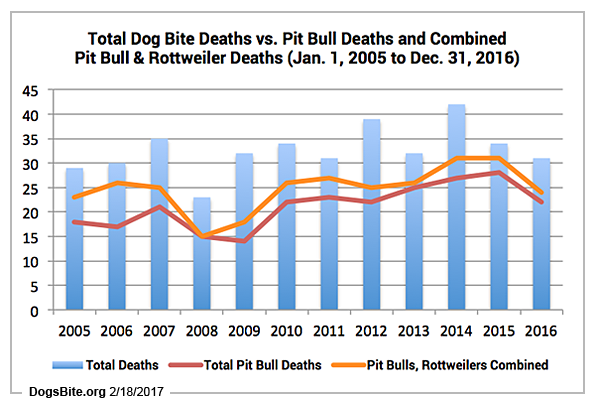
- Together, pit bulls (22) and rottweilers (2), the second most lethal dog breed, accounted for 77% of the total recorded deaths in 2016. This same combination also accounted for 76% of all fatal attacks during the 12-year period of 2005 to 2016.
- The breakdown between these two breeds is substantial over this 12-year period. From 2005 to 2016, pit bulls killed 254 Americans, about one citizen every 17 days, versus rottweilers, which killed 43, about one citizen every 102 days.
- See full report: 2016 U.S. Dog Bite Fatality Statistics - DogsBite.org
- News release: Nonprofit Releases 2016 Dog Bite Fatality Statistics and Trends from 12-Year Dog Bite Fatality Data Set (2005 to 2016)
Discussion Notes
DogsBite.org - 2016 marked a decrease in U.S. dog bite fatalities, which do vary from year to year, but overall have been on an upward trend since 2009. This year, we recorded 31 total deaths. There may have been more. The election dominated the media in 2016. As one can see from our 12-year chart, there was a significant dip in 2008, which was also the change of an administration. What remained true in 2016 was the high rate of pit bull fatalities, weighing in at 71% of all deaths.
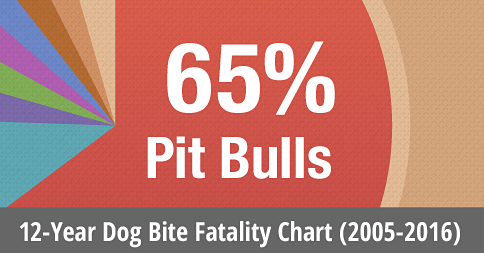
This 12-year period shows that deaths inflicted by pit bulls, 254, now exceeds the total number of deaths by all dog breeds in the 8-year period of 2005 to 2012. It also exceeds the number of deaths (238) analyzed in the government's benchmark 20-year study from 1979 to 1998 when breed data was known. When we began charting combined year fatality statistics in 2011, pit bulls were inflicting 58% of all deadly attacks. Five years later, pit bulls have reached 65%.
2016 Annual Trends
In 2016, 42% (13) of all dog bite fatality victims were either visiting or living temporarily with the dog's owner when the fatal attack occurred -- the highest on record. Pit bulls were responsible for 77% (10) of these deaths. This growing trend alters traditional metrics, which in the past was dominated by a family dog killing a child or family member and deadly off property pack attacks. In 2016, the majority of victims killed while visiting the dog owner's home were also adults 54%.
During the 11-year period of 2005 to 2015, children 10-years old and younger were the primary victims, 71% (70 of 99), in the visiting scenario.
A larger than average number of dog breeds killed in 2016 -- a total of 10 different breeds.1 Having never appeared in any previous years of our fatality statistics, the Belgian malinios inflicted two deaths in 2016. One was a large pack attack of Belgian malinios-American bulldog mixes in Miami-Dade County. The other was a "pet" dual-certified police K-9 in San Luis Obispo County. The owner of the K-9, now a former police officer, was subsequently charged with two felonies.
In 2016, newborns ages 3 to 6-days old accounted for 31% of all child deaths. That is alarming. The educational advancements in infant safety today, even from just 10-years ago, are formidable. Yet common sense about dogs is fading. No dog should be near a baby that young, much less lying in bed with it, as was the case when a large, rehomed pit-bull mix killed 3-day old Sebastian Caban. The family had adopted the dog 5-months earlier from the San Diego Humane Society.
Changing Traditional Fatal Dog Mauling Metrics
Single Dog Metric Shrinking Metric Shift
In 2016, 61% of all dog bite fatalities involved more than one dog, up from the 11-year average of 44%. Again the past metric of a single dog, usually a family dog, being the primary inflictor of fatal dog attacks is diminishing and being replaced by multiple dogs, chiefly pit bulls. In our 12-year data set of 392 deaths, 46% (179) involved attacks by more than one dog. Attacks by pit bulls involving more than one dog (typically another pit bull), contributed to 72% (128) of this subset.
Even an early CDC study (1989 to 1994) noted that 33% of all fatal pit bull attacks involved more than one dog vs. 21% of attacks involving other breeds. The 12-year data set also shows that both types have escalated since. Today, 50% of all fatal pit bull attacks (128 of 254) involve more than one dog, vs. 37% of all other dog breeds combined (51 of 138). In our modern 12-year data set, pit bulls also accounted for 71% (71 of 100) of all deaths that involved recent breeding activity.
Multi-pit bull households are diminishing the traditional metric of a single dog inflicting the most fatal attacks and have been for years.
Single Dog Involved in Fatal Dog Attacks - Various Studies (1979-2016)
| % Single Dog | Years | Single Dog of Total Studied | Entity/Study |
|---|---|---|---|
| 70% | 1979-1988 | (76 of 108) | CDC/Sacks 1989 |
| 73% | 1989-1994 | (62 of 85) | CDC/Sacks, 1996 |
| 67% | 1979-1998 | (160 of 238) | CDC/AVMA, 2000 |
| 56% | 2005-2010 | (102 of 183) | DogsBite.org, 2017 |
| 52% | 2011-2016 | (109 of 209) | DogsBite.org, 2017 |
| 39% | 2016 | (12 of 31) | DogsBite.org, 20172 |
Adult Deaths Outpace Child Deaths Metric Shift
2016 marks another year when dogs killed more adults than children, 58% and 42% respectively. Our combined 12-year data set shows that children, 9-years old and younger, accounted for 49% of all victims. This is a great shift from the past metric during the early CDC study period (1979 to 1988) when 70% of all victims were 9-years old and younger. The chart below depicts a rise of adult deaths, primarily in the 30 to 69-year old age groups, over the years from 1979 to 2016.
Adults Killed in Fatal Dog Attacks - Various Studies (1979-2016)
| % Adults | Years | 0-9 | 10-29 | 30-49 | 50-69 | 70+ | Total | Entity/Study |
|---|---|---|---|---|---|---|---|---|
| 30% | 1979-1988 | 70% | 6% | 3% | 11% | 10% | 157 | CDC/Sacks 1989 |
| 43% | 1989-1994 | 57% | 5% | 9% | 10% | 19% | 108 | CDC/Sacks, 1996 |
| 47% | 2005-2010 | 53% | 7% | 10% | 14% | 16% | 183 | DogsBite.org, 2017 |
| 54% | 2011-2016 | 46% | 3% | 14% | 20% | 18% | 209 | DogsBite.org, 2017 |
| 58% | 2016 | 42% | 0 | 19% | 26% | 13% | 31 | DogsBite.org, 20173 |
Which Breeds Are Killing Adults? Metric Validation
The same early CDC study (1979 to 1988) noted that 31% of all pit bull victims were ages 10 and older, compared to 19% for other breeds. Our 12-year data set shows a great increase in pit bulls killing adults. Of the 392 people killed by dogs from 2005 to 2016, 51% (199) were victims 10 and older. Pit bulls were responsible for 71% (141) of these deaths vs. all other breeds combined 29% (58). Of the total 254 people killed by pit bulls during this period, 56% (141) were 10 and older.
To re-emphasize, in the recent data set of 12-years, pit bulls were responsible for 71% of all fatal attack victims ages 10 and older.
Fatality Victim Ages - Pit Bulls vs. All Other Dog Breeds Combined
| Category | 0-2 | 3-4 | 5-9 | 10-18 | 19-29 | 30-49 | 50-69 | 70+ | Total |
|---|---|---|---|---|---|---|---|---|---|
| Total Deaths | 105 | 41 | 47 | 7 | 12 | 47 | 67 | 66 | 392 |
| 51% ages 10 and older | 199 | ||||||||
| Pit Bulls | 60 | 22 | 31 | 6 | 12 | 33 | 47 | 43 | 254 |
| 71% ages 10 and older | 141 | ||||||||
| All Other Breeds Combined | 45 | 19 | 16 | 1 | 0 | 14 | 20 | 23 | 138 |
| 29% ages 10 and older | 58 | ||||||||
What Metric Remains the Same?
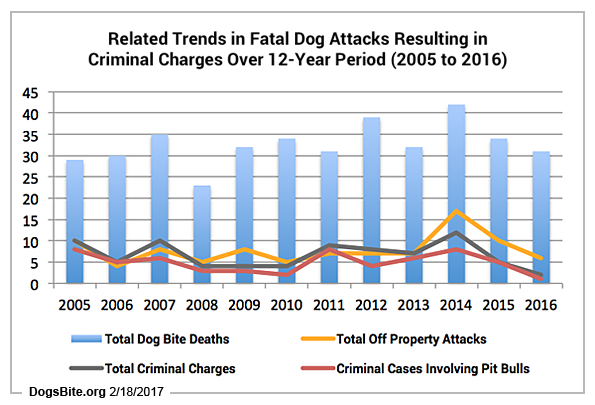
The 12-year data set shows that 24% (94) of all fatal attacks occurred off the dog owners' property, the exact same percentage as the 20-year CDC study published in the last century.4 During the 12-year period, pit bulls accounted for 66% (62) of these deaths. Of this pit bull subset, 82% (51) involved multiple dogs. Over half of all criminal cases involve off property attacks. Thus, off property attacks and criminal charges tend to mirror one another in the below 12-year chart.
Then we added a third mirror to the chart -- pit bulls. In the 12-year data set, only 20% (80) of all deaths resulted in criminal charges -- felonies or misdemeanor charges with jail time. Pit bulls accounted for 74% (59) of these cases. Among the 254 pit bull fatalities, 23% (59) resulted in criminal charges vs. 15% (21) for all other breeds combined. Measuring breed-to-breed, pit bulls had nearly twice the rate of rottweiler attacks, 12% (5 of 43), resulting in criminal charges.
53% (42) of all criminal cases involve off property attacks. Pit bulls killing off property and charges resulting accounted for 74% (31) of this subset.

Summary and Call-to-Action
12 years of fatal dog bite statistical data is sufficient to evaluate the "breed-specific" issue. Pit bulls dramatically dominate attacks causing death. With the addition of rottweilers, these two breeds accounted for 76% of all deaths. When mastiff-type guard dogs and war dogs are added -- the types used to create "baiting" bull breeds and fighting breeds5 -- this small group of breeds is responsible for 84% of all fatal attacks. Breed-specific laws are more needed now than ever.
As we stated in our Call-to-Action last year, instead, what is happening is the reverse. Powerful lobbying groups continue to push preemption bills on a state level that prohibit municipalities from adopting and enforcing breed-specific laws. Importantly, over the last two years legislatures in 10 different states have rejected these bills -- 94% failed to pass. Currently four states face this type of legislation in 2017, including: Delaware, Missouri, Washington and West Virginia.
Our call to action this year is the same as 2016: Use our statistics and charts in correspondence with local and state officials, especially the chart showing 12-years broken down by year that depicts how heavily two breeds, pit bulls and rottweilers, dictate fatal attacks. Use our nonfatal severe injury research as well. Last October, we published a special report that summarized key peer-reviewed medical studies (2009 to 2016) that examined the severity of pit bull injuries.
Additional Annual and Combined Year Statistical Graphics (2005 to 2016)


Data Collection Method: How We Collect U.S. Dog Bite Fatality Data
2, 3Single year statistics may or may not represent an actual trend; trends are revealed through combined years, preferably 100 cases or more. We just offset 2016 because it is the subject of this post.
4See first page under results. "Of 227 reports with relevant data, 55 (24%) human deaths involved unrestrained dogs off their owners' property..."
5This grouping includes: American bulldogs, mastiffs and bullmastiffs, presa canarios and cane corsos.
Related articles:
01/09/17: 2016 Fatal Dog Attack Breed Identification Photographs
02/19/16: 2015 U.S. Dog Bite Fatality Statistics - DogsBite.org
01/14/16: 2015 Fatal Dog Attack Breed Identification Photographs
07/24/14: Nonprofits Urge CDC to Resume Tracking Richer Data Set for Children and Adults...
Recent Nonfatal Studies:
10/10/16: Special Report: Level 1 Trauma Center Dog Bite Studies in All U.S. Geographical...

Another fatality this morning: http://whnt.com/2017/12/07/one-woman-dead-another-injured-after-dog-attack-in-section/