
Self-Reported Dog Bites by Year, Borough and Breed in New York City
Dog bite incidents in New York City pre- and post-Covid (2015-2023)
DogsBite.org - Starting in June, our nonprofit analyzed dog biting incidents collected by New York City's Department of Health and Mental Hygiene (DOHMH) over the 9-year period of January 1, 2015 to December 31, 2023. This report provides a comprehensive analysis of 29,992 self-reported dog bite incidents involving humans to identify key dog biting trends pre- and post-Covid (2018 vs. 2023), trends among the top-biting dog breeds and trends related to the geography of the biting incidents.
This report also provides an analysis of dog bite injury rates per population 100,000 in New York City to more closely identify these pre- and post-Covid trends, trends among the top-biting dog breeds and trends in each borough. The broad pattern of dog bite injury rates in the city -- a steep drop during the 2020 peak Covid year, and a sharp rise after -- is also reflected in the national rate of dog bite injury emergency department (ED) visits during this period, which we review in this report's addendum.
Sources and Methodology
The DOHMH database consists of self-reported dog bites, which are reported via online, mail, fax, or phone to the DOHMH Animal Bite Unit. Each record represents a single dog bite and provides data on the: (1) date of bite (2) breed of dog (3) age of dog (4) gender of dog (5) spay or neuter status and the (6) borough and zip code of the person bitten. Information on dog breed, age, gender and spay or neuter status have not been verified by DOHMH and is listed only as reported to the agency.
Due to the bites being self-reported, there were multiple spellings for the same dog breed and over 150 unique breeds. Thus, we created groups for several breeds. The "pit bull group" includes: American pit bull terrier, American Staffordshire terrier, Staffordshire bull terrier, and pit bull. The "mixed-breed group" includes: All sizes (large, medium, small and unspecified) designated as "mixed," "mixed breed" or "mutt." The "poodle group" includes: All sizes (toy, miniature, standard, and unspecified).
Population data from the U.S. Census Bureau was used to determine the dog bite injury rate (per population 100,000) for each New York City borough. The national rate of dog bite injury emergency department (ED) visits was supplied by WISQARS. California dog bite injury ED visits was supplied by California Health and Human Services; the state's population data was supplied by Macrotrends. Florida dog bite injury ED visits and injury rate was supplied by the Florida Department of Health.
New York City Dog Bite Trends by Year, Pre- and Post-Covid (2018 vs. 2023)
There were 29,992 self-reported incidents of dog bites collected by DOHMH over the 9-year period of 2015 to 2023.1 The average number of bites per year was 3,332. There was a sharp drop in bite reports, 28%, during the 2020 peak Covid year, which reduced this annual average. Between the pre- and post-Covid years of 2018 and 2023, the number of reported dog bites in New York City rose 14%. By 2022, self-reporting had normalized and reports of dog bite incidents exceeded 2018 levels.
Among the top-biting breeds, pit bull biting incidents rose a modest 5% between the pre- and post-Covid years of 2018 and 2023, and bites inflicted by "mixed-breed" fell 34%. Bites inflicted by "unknown" breed rose 107% and occurred most frequently in the Manhattan borough. Since 2015, bites inflicted by pit bulls have trended downward in the city -- a 23% decline between 2015 and 2023. Bites inflicted by "unknown" breed have trended upward -- a 119% rise between 2015 and 2023.
Dog bite injuries to humans can range from mild to severe. The DOHMH database, however, does not collect injury severity. Other pre- and post-Covid dog bite data we analyzed previously -- Austin and San Antonio, Texas and San Bernardino County, California -- did collect injury severity data. Furthermore, one study states that DOHMH dog bite records may underestimate the total number of dog bite injuries treated in emergency departments (EDs) in New York City by a factor of 4 times.2
Related report:
Report: New York City Dog Bites, Top-Biting Breeds Pre-and Post-Covid (2018 vs. 2023)
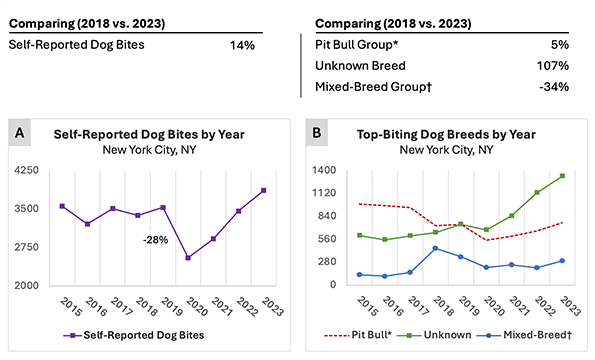
Chart A: Self-reported dog bites by year | Chart B: Top-biting dog breeds by year (2015-2023)
New York City Dog Bites by Breed, Gender & Reproductive Status, 9-Year Period
Of the 29,992 dog bite records collected, breed of dog was known in 76% (22,860) of cases. Pit bulls inflicted 30.4% (6,959) of these bites. Pit bull bites surpassed the next top-biting breed, "mixed-breed" (2,169), by over 3 times and the next top-biting distinct breed, shih tzu (1,077), by over 6 times. Chihuahuas followed with 1,020 bites, German shepherds, 996 bites, and Labrador retrievers, 776 bites. Bites inflicted by "unknown" breed, a group larger than pit bulls, inflicted 7,132 bites.
When gender was known, male dogs were the predominate biters, weighing in at 72% vs. female at 28%. Notably, gender was only captured in 51% (15,443) of cases. Among the top-biting breeds, each show males leading from 68% to 76%. When comparing the pit bull group to the non-pit bull group, the results are similar. Regarding the reproductive status of male biting dogs, intact male dogs were more common in the pit bull group, 66% (1,517 of 2,314), than the non-pit bull group, 53% (4,681 of 8,847).
The combined intact rate of male and female dogs also shows a higher rate for pit bulls, 63% intact vs. 37% spay or neutered, than the non-pit bull group, 52% intact vs. 48% spay or neutered. This data pertains to biting dogs only. A 2011 study with a sample size of 1.3 million dogs examined at 651 private U.S. veterinary hospitals, also found that among the 10 most commonly reported breeds, male pit bulls were the least likely breed to be castrated, 27%. The other 9 dog breeds averaged 62% castration.3
Related report:
Report: New York City Dog Bites by Breed & Reproductive Status, 9-Year Period (2015-2023)
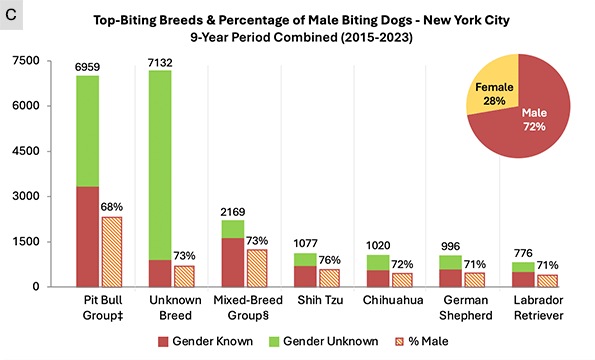
Chart C: Top-biting dog breeds (gender known/unknown), and percentage of male biting dogs.
New York City Dog Bite Injury Rate by Borough, Pre- and Post Covid (2018 vs. 2023)
The dog bite injury rate per 100,000 population for each borough was calculated using borough population data for each year from 2015 to 2023.4-5 Staten Island consistently had the highest injury rate (40.60 to 69.96) and Brooklyn the lowest (20.28 to 30.90). Comparing the pre- and post-Covid years of 2018 vs. 2023, the injury rate in all boroughs increased, except Manhattan, which fell 8%. The rate grew the most in the Bronx, 40% (41.83 to 58.68), followed by Staten Island, 27% (53.97 to 68.72).
The rate of self-reported dog bites fell 31% during the 2020 peak Covid year. In each borough, dog bite injury rates also fell. The declines ranged from 27% in Queens to 36% in the Bronx. By 2022, most boroughs reflected their pre-Covid 2018 dog bite injury rate. By 2023, most boroughs surpassed their 2018 injury rate levels. Between 2015 and 2020, the injury rate in Staten Island had been declining. That trend reversed in 2021. By 2023, the rate nearly matched its highest recorded rate since 2015.
New York City Dog Bite Injury Rate by Borough & Breed, 9-Years Combined
We reviewed injury rates for the top-biting breeds by borough for the 9-year period combined (2015-2023). When breed was known, pit bulls inflicted an injury rate over 3 times higher than other breeds in 4 of the 5 boroughs. The least populated borough, Staten Island, had the highest pit bull injury rate (15.51), followed by mixed-breed (4.29). The Bronx had the highest injury rate for two toy breeds, shih tzu (1.84) and chihuahua (1.97). Manhattan had the highest injury rate for "unknown" breed (14.13).
We also analyzed injury rates for the top-biting breeds by borough by year from 2015 to 2023. Comparing the pre- and post-Covid years of 2018 vs. 2023, the pit bull injury rate rose in 4 of the 5 boroughs between 5% to 15%. The injury rate of "unknown" breed rose in all boroughs between 69% to 253%. The populations of specific breeds are unknown, but according to DOHMH, which issues dog licenses, the most common licensed dog breed in New York City (2015-2023) is "unknown" breed.6
Related report:
Report: New York City Dog Bite Injury Rate by Borough, Breed & Years (2015-2023)
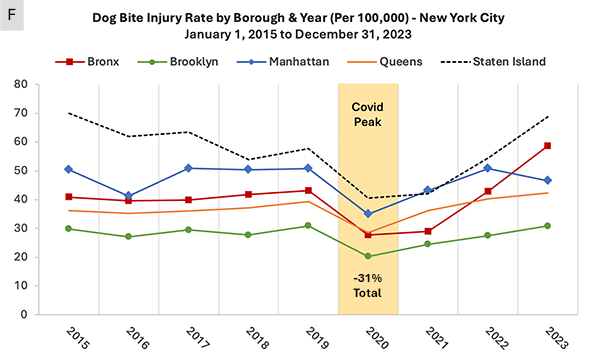
Chart F: Dog bite injury rate by borough and year in New York City. Not age-adjusted.
Discussion: The Rise of "Unknown" Breed Designation
We obtained dog licensing data from DOHMH and compared this to the top-biting dog breeds by year from 2015 to 2023.7 The licensing of "unknown" breed explodes in 2016 and continues at a high level through 2020 (8,000+) then in 2021 plummets below the second-most licensed dog breed, shih tzu (5,838).8 The 2016 surge is likely connected to a June 1, 2015 city law requiring rescues and pet shops to obtain a completed pet license application and fee at the point of the adoption or purchase.9
New York City Animal Care Center is the largest animal shelter in the city with 3 adoption locations. In November 2017, the agency removed breed labels under the "boroughbred" campaign. Afterward, some private Manhattan rescues also omitted breed labels, including, the American Society for the Prevention of Cruelty to Animals, Bideawee and Muddy Paws Rescue.10-12 The mixture of the 2015 city law and local shelters removing breed labels is likely tied to the rise of "unknown" breed licenses.
The primary reason for shelters to "remove breed labels" is to more easily adopt out pit bulls.13-16 Pet restricted housing, such as for breed and size, and "no pet" clauses, is commonplace in New York City. Landlords can review the licensing documentation to accept or reject the dog. Licensing a dog as "unknown" or "mixed-breed" works in favor for a tenant who has a restricted dog breed. Shelters and rescues that omit dog breed labels can impact the landlord approval process or lease agreement.17
The dog bite dataset shows that bites of dogs by "unknown" breed rise steadily through 2020 then jump 97% by 2023. By contrast, between the same two years, pit bull bites rise 39% and mixed-breed bites rise 37%. The 2017 campaign, kicked off by billboards and more, -- "The boroughbred is the only breed for me!" -- may also be linked to the rise of bites by "unknown" breed. But there are different reasons why a person might report "unknown" breed for a biting incident rather than a dog license.
Related report:
Report: New York City Dog Licensing and Dog Bite Data After "Boroughbred" Campaign
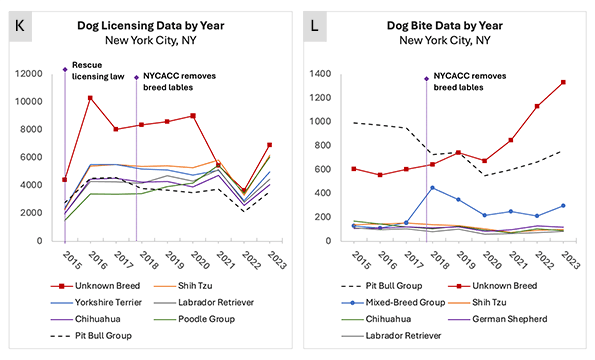
Charts K,L: Dog licensing and bite data after licensing law & "boroughbred" campaign.
Summary
Between 2015 to 2023 there were 29,992 self-reported dog bites to the New York City Department of Health and Mental Hygiene. Between the pre- and post-Covid years of 2018 and 2023, the number of self-reported dog bites increased 14%. There was a 28% drop in reported bites during the 2020 peak Covid year. Dog bite injury rates per population 100,000 in the city fell 31% during 2020 as well. The lowest decline in injury rate by borough was 27% in Queens, and the highest was 36% in the Bronx.
Over 150 distinct dog breeds were involved in these bites. Breed was identified in 76% of cases (22,860). Pit bulls accounted for 30.4% of biting incidents when breed was known. Pit bulls inflicted over 3 times more bites than the next top-biting breed, "mixed-breed," and over 6 times more than all other distinct breed categories. Bites inflicted by "unknown" dog breeds increased 107% between the pre- and post-Covid years of 2018 to 2023 and most often occurred in the Manhattan borough.
When gender was known, 51% of cases, male biting dogs accounted for 72% vs. female biting dogs, 28%. Among the top-biting breeds, male dogs accounted for 68% to 76% of bites. There was little difference when comparing male biting dogs in the pit bull group to the non-pit bull group. But intact male dogs were more common in the pit bull group, 66%, than the non-pit bull group, 53%. Pit bulls also had a higher intact rate when both sexes were combined, 63% vs. 52% non-pit bull group.
Among the city's 5 boroughs, Staten Island had the highest dog bite injury rate (56.89) per 100,000 population over the 9-year period combined (2015-2023). Brooklyn had the lowest injury rate (27.54). When breed was known, pit bulls inflicted over 3 times the injury rate in 4 of the 5 boroughs than the other top-biting breeds. Between the pre- and post-Covid years of 2018 to 2023, the average pit bull injury rate by borough only rose 5%, while the average injury rate of "unknown" breed rose 132%.
Conclusion
Our analysis of nearly 30,000 dog bites in New York City from 2015 to 2023 reveals several trends. Three key findings stand out: one, bite incidents by pit bulls are significantly overrepresented when breed was identified; two, the post-Covid surge in bite incidents attributed to dogs of "unknown" breed now dominates the data, which presents a significant data gap for dog bite analysis; and three, there is a persistently high dog bite injury rate in Staten Island compared to the other boroughs.
Addendum: National ED Rate
While analyzing New York City data, we also obtained data from WISQARS, which shows the national rate of emergency department visits (ED) for dog bite injuries. The national rate per 100,000 population rose 15% between the pre- and post-Covid years of 2018 and 2023. The rate in California rose 30%, and in Florida, 25% -- the only two states with open data. All three entities show a sharp drop during the 2020 peak Covid year, and by 2023 had surpassed all injury rate levels in their modern history.18
From 2011 to 2019, the national rate of ED visits due to dog bite injuries had been steadily falling (114.0 to 100.4). That trend reversed in 2022. Rates in the two sunshine states, California and Florida, have been on an upward trend since 2005. Each of the injury rates converge between 95.0 to 98.7 during the 2020 peak Covid year then sharply rise. The pre- and post-Covid pattern of dog bite injury rates in national and state data is also reflected in the localized injury rates in several of the city's boroughs.
A distinctly different pattern emerged in national dog bite fatalities pre- and post-Covid. Fatal dog maulings did not fall during the 2020 peak Covid year, the attacks escalated. Starting in 2019, pre-Covid, dog bite fatalities surged upwards, rising 100% from 2019 to 2023, according to CDC data. Provisional data for 2024, the most recent data available, shows this rise increased to 165% from 2019 to 2024. This substantial rise follows a 14-year period (2005 to 2018) of comparatively minor growth.
Related report:
Rate of U.S. Dog Bite Emergency Department Visits vs. California & Florida (2005-2023)
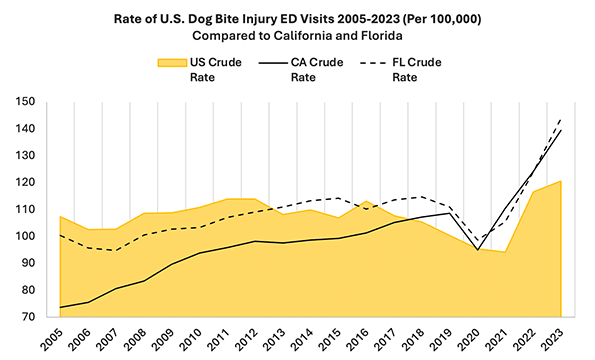
Chart: U.S, California and Florida rates of dog bite injury ED visits. Not age-adjusted.
Data Limitations
The DOHMH database consists of self-reported dog bites. Each record represents a single dog bite and collects multiple parameters about the dog involved. Information on the breed, age, gender and reproductive status of the dog involved have not been verified by DOHMH. Also, a true number of intact dogs is unknown because the database entry for Spay or Neuter is a TRUE or FALSE answer. FALSE equals two values: Unknown (or) Intact. Dogs with an unknown gender also default to FALSE.19
There were 29,992 database records over the 9-year period of 2015 to 2023. This count may severely underestimate the number of dog bite injuries treated in emergency departments (ED) in New York City during the same period. One study states that from 2015 to 2017, there were 10,280 database records compared to the number of dog bite injuries treated in EDs in the city, which totaled 44,947.20 Unlike many ED records, however, DOHMH records capture dog information. Utilizing both data is helpful.
We reviewed 669,444 dog licensing records from the DOHMH between 2015 and 2023 to determine the top-licensed dog breeds by year based upon the license issue date. This was reduced to 629,173 after removing duplicate rows, averaging to about 70,000 active licenses per year. According to the New York City Economic Development Corporation, at least 600,000 dogs reside in the city.21 Dog licensing data falls woefully short of this number, but it provides a snapshot of breed populations.
Table: U.S. Dog Bite Fatalities
CDC Wonder UCD Deaths vs. DogsBite.org Deaths (Jan. 1, 2005 to Dec. 31, 2024) | View Chart
| Year | Total (CDC UCD Data) | Total (Nonprofit Data) |
|---|---|---|
| 2005-2018 Avg. | 33.64 Avg. (471 total) | 33.79 Avg. (473 total) |
| 2019 | 48 | 50 |
| 2020 | 62 | 47 |
| 2021 | 81 | 53 |
| 2022 | 98 | 56 |
| 2023 | 96 | 63 |
| 2024 | 127 (provisional) | 68 |
| Total | 983 | 810 |
| Year Set | Change (CDC) | Change (Nonprofit) |
| 2019-2023 | 100% | 26% |
| 2019-2024 | 165% | 36% |
2Tuckel PS, Milczarski W, The Changing Epidemiology of Dog Bite Injuries in the United States, 2005–2018, Injury Epidemiology, 01 November 2020.
3Trevejo R, Yang M, Lund EM, Epidemiology of surgical castration of dogs and cats in the United States, J Am Vet Med Assoc, 2011 Apr 1;238(7):898-904.
4Current Estimates of New York City's Population for July 2015, July 2016, July 2017, July 2018, July 2019, U.S Census Bureau Data, NYC Department of City Planning Population Division, data released and/or modified May 3, 2022 (Accessed: December 2, 2025).
5New York City’s Population Estimates and Trends, U.S. Census Bureau, Population Estimates Program Vintage 2024, July 2020, July 2021, July 2022, July 2023, NYC Department of City Planning Population Division, released May 2025 (Accessed: December 2, 2025).
6New York City Dog Licensing Dataset, NYC Open Data, metadata last updated February 25, 2025, Department of Health and Mental Hygiene (data.cityofnewyork.us) Data downloaded: November 7, 2025.
7We measured active dog licenses on a year-by-year basis. Thus, if a dog named "Fido" was licensed during the years 2015, 2016 and 2017, Fido was counted as 1 active license for each of those years.
8New York City dog licenses can be purchased for 1 or 5 years. Because no tag or animal ID number is in the open dataset, we could not determine which dogs licensed as "unknown" breed during the 2016 surge had a 5-year license, which might have contributed to the 2016-2020 high of "unknown" breed licenses that abruptly crashed in 2021.
9Testimony (November 2014), "The proposed legislation would add new Section 17-814 to the Administrative Code to provide that a pet shop or animal rescue group cannot sell or release a dog to a purchaser or adopter unless the purchaser or adopter first completes an application for a dog license and pays the dog license fees." | Animal Law Committee of the New York City Bar Association (nycbar.org).
10Pre-2021 | It's unclear when the ASPCA removed breed labels, but they state during the launch of the "boroughbred" campaign, "Every ACC pet is now more unique and distinct than a plain old breed label could ever capture." The last year we could find breed labels on the ASPCA's adoption listings was 2020. But judging online listings for breed label removals inside of a facility is tricky because the adoption listing software may require a breed to be listed.
11December 2017 - Bideawee was the subject of a breed label study from February 2016 to June 2019. The study states, "Bideawee, a limited admission shelter with three locations in the greater New York area, including one in NYC, phased out breed labels from their adoption cards in December 2017."
12June 2021 - In 2021, Muddy Paws Rescue was a recipient for a $1,000 grant to remove breed labels by Animal Farm Foundation, which plays a key role in the pit bull lobby, according to Wikipedia. The group was also called out as the "Level 1: The financing source" of the five levels of the pit bull lobby by La Presse in 2016, a Montreal-based news organization. Muddy Paws Rescue announced on June 3, 2021: "When you see our dogs on our website, their profiles will now say “unknown breed”—because that’s the truth!"
13Hoffman C, Harrison N, Wolff L, Westgarth C., Is that dog a pit bull? A cross-country comparison of perceptions of shelter workers regarding breed identification, J. Appl. Anim. Welf. Sci. , 2014. October 2;17(4):322–39. | This study states that 41% of animal shelter workers would knowingly mislabel a pit bull (if a "restricted breed") as another breed in order to help the dog's adoption chances. Also, over 90% of participants in this study were female.
14Gunter LM, Barber RT, Wynne CDL, What's in a Name? Effect of Breed Perceptions & Labeling on Attractiveness, Adoptions & Length of Stay for Pit-Bull-Type Dogs, PLoS One, 2016 Mar 23;11(3):e0146857. | This study carried out 3 experiments about the perception of pit bulls by potential adopters. A 4th study examined the length of stay (LOS) of pit bulls when breed labels were present or removed. When breed labels were removed, the LOS was reduced by 1.5 days.
15Gunter LM, Barber RT, Wynne CDL, A canine identity crisis: Genetic breed heritage testing of shelter dogs, PLoS One, August 23, 2018.
16Some studies designed to test "breed labels" also failed to achieve expected outcomes, such as a decreased length of stay (LOS) at the shelter after removing breed labels. A 2018 pilot study funded by Maddie's Fund, Do Labels Matter? A Pilot Study, showed just that. "Absence of breed information on cage cards resulted in a longer length of stay for dogs."
17Ask the Experts: Pet Policies, Emotional Support Animals, and New York City’s 90-Day Pet Law, First Service Residential, October 25, 2024 (fsresidential.com).
18(1) U.S. rate of dog bite emergency department (ED) visits and population data supplied by WISQARS; Data downloaded September 1, 2025. (2) California dog bite ED visits supplied by California Health and Human Services; Data downloaded September 2, 2025. California population data supplied by Macrotrends.net (3) Florida rate of dog bite ED visits supplied by the Florida Department of Health; Data downloaded September 2, 2025.
19Therefore, we excluded dogs with an unknown gender.
20(Tuckel, 2020)
21Mary Kearl, "Pets in the City: A New York City Guide for Pet Parents," PetCareRX, October 11, 2025 (petcarerx.com).
Related articles:
05/30/25: Rising Dog Maulings in Two Central Texas Cities Pre- and Post-Covid (2018-2023)
06/03/25: Macro-Level Forces Report: Covid Impacts of 2023 U.S. Dog Bite Fatality Capture Rate
10/18/24: Macro-Level Forces Report: Covid Impacts of 2022 U.S. Dog Bite Fatality Capture Rate
04/18/23: Macro-Level Forces Report: Covid Impacts of 2021 U.S. Dog Bite Fatality Capture Rate
09/23/22: Macro-Level Forces Report: Covid Impacts of 2020 U.S. Dog Bite Fatality Capture Rate
Thank you for this admirably comprehensive and meticulous study of dog bites and fatalities in the U.S. over a significant chunk of time. The more granular data from NYC complements satisfyingly the broader conclusions to be drawn from the national and state data. You have provided a solid baseline source for both interested citizens and other researchers. Terrific job!
Incorrectly listing dog breeds or outright lying about them has been present for many years. A tenant who wanted to move into my place said she had two mixed breed dogs. Her male was a vicious, very dangerous purebred pitbull. Her pitbull bitch might have been mixed, and she became aggressive at two years of age and was gotten rid of. She and her husband got more pitbulls, as I saw them in their pickup truck after their rented house was torched by a grease fire and throwing water on it. I think a lot of folks renting apartments request to see their prospective tenants’ dogs. Pitbull owners have known to lie about their dogs’ breed for a very long time.